The History of PolygonFluxThe Ink & Paper EraIn 1976, wanted to explore internal reflection dynamics of pyramid structures. When 3D proved too difficult, I dropped to 2D to see if anything interesting happened. So my quest became to investigate the path of a particle "bouncing around" inside regular and concave polygons.A student lab assistant and physics major, Corey Hirsh, wrote a program for triangles using point-slope formulas. That complicated the logic, but he was able to get it functioning, so we experimented with equilateral, scalene, obtuse, and right triangles. Corey programmed in FORTRAN, and the output was via a pen plotter attached to a punched card computer system. Corey, are you out there??

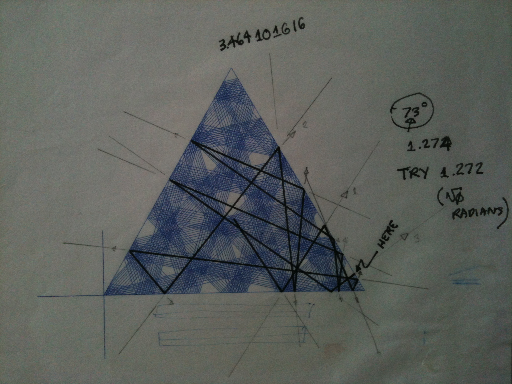
CalComp Plotter Output with Handwriting Another Version using Ink on PaperBy 1977, Corey said that the program could not easily be extended to N-sided polygons. (In fact, he never showed me his program!) So, I found a more general representation of the polygon and the "vector" (the point bouncing around) so that I could simulate n-sided polygons. I ran into a problem that I couldn't crack, so I enlisted the help of algebraist Greg Davis who debugged the algorithm. Plotting was still time consuming, taking minutes just to try one angle and starting position.At some point, I put everything in a folder I named "Polygonal Billiards" and went on to other problems. The plotter and computer system was eventually phased out. Green Tube CRT DisplayIn about 1983, the college acquired some TekScope 4010 CRT displays, which were much faster than pen on paper. The hardcopy output was expensive silver paper. I re-coded my program from FORTRAN to BASIC to use the graphics routines. I could run the program, enter the parameters, and see what came out on the screen. ERASE. Repeat. Then print something once and a while.

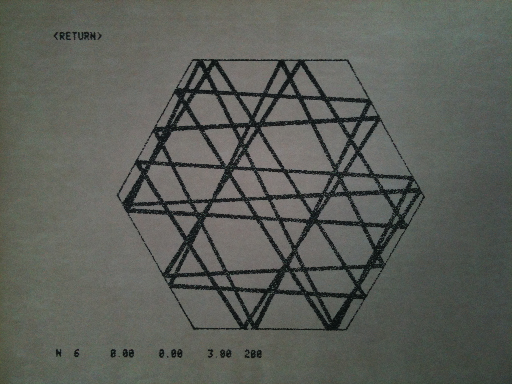
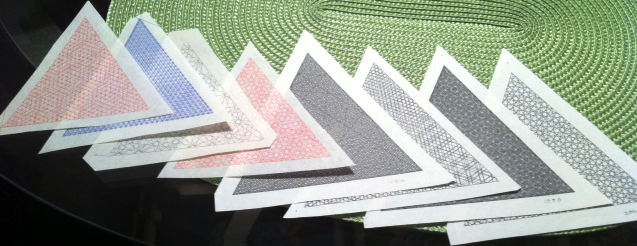
TEXTRONIX silver paper "hardcopy" plot PostScript PrintersIn 1995-96, I converted the program to C in order to generate high-resolution PostScript output. (The photo below shows a mix of older colored-ink plotter fluxagons, and newer PostScript printer fluxagons.)

Fluxagons output on Plotter, and on Postscript printer The new "World Wide Web"I adapted the C language program to generate GIF's for my personal web pages at the college, and put them under Polygonal Billiards on my Geom-e-Trees page.The iPadIn August 2011, I adapted the C program to Objective-C, using Quartz graphics for iOS. It was fantastic to see the flux respond in real time for the first time on the iPad.I came up with the name PolygonFlux after days of surveying the extensive literature that has developed around this well-defined problem. I discovered that this problem area had been named "Polygonal Billiards" by others as well. I also coined the term "Fluxagon" for the polygon + flux combination. I adapted features from my Geom-e-Tree app to make PolygonFlux more useful. PolygonFlux will now allow many people to explore this space effortlessly, and also to collect fluxagons to study and share. |
ThanksTo Greg Davis, mathemetician, Portland, Oregon. Once the code was running on the iPad, I noticed a curious bug. It chose the wrong side seemingly at random, but only from the initial point. Once it got going, it did OK. I re-enlisted Greg's help. We studied the situation and figured out when it was failing. Greg then figured out why and made a one line fix to the algorithm.To August Miller, Portland State University graphics design student par excellent. Gus executed the v1.0 App icon, four tab bar icons, the +/- arrows, the "Loading..." page, and he did a bang-up job laying out the help page and providing those graphics. Every graphic you see (except for the flux!) is his work. Gus reviewed the user interface, typography, and the over-all look & feel a number of times during development. Once we've seen what all PolygonFlux can do, he will update the App icon for future versions. I haven't implemented all of his suggestions yet! To MARTIN GARDNER (1914-2010), who stimulated my imagination every month for decades. He might think I am going too far by saying the app lets you experience the flow of energy inside a polygon, but then I don't know what he would think of the iPad being used for Mathematical Games. Do you? To You. I'd like to hear your ideas how we can make PolgonFlux even better.
John Miller |
EndnotesThe paper plots were done in 1976 at Lewis & Clark College in Portland, Oregon, using a drum-and-carriage-style plotter attached to an IBM 1130 Computing System.The plotter had a supply of paper on a roll, which could be fed onto a 8" diameter aluminum drum, with a take-up spool around on the other side. The drum could rotate either direction so once the paper was on the drum, either spool could feed or take-it back. A pen was mounted on a "sled" that could be cable-pulled left or right on two rods that spanned the 30" width of the drum. The program could lower the pen to draw while moving the drum and carriage, or raise the pen to move to a new location. Stepping motors ran the whole thing at maybe 12,000 steps/minute, in 1/200 inch increments. See the Calcomp 1627 on Wikipedia. A smaller Model 1 is currently shown. |
| PolygonFlux Home |